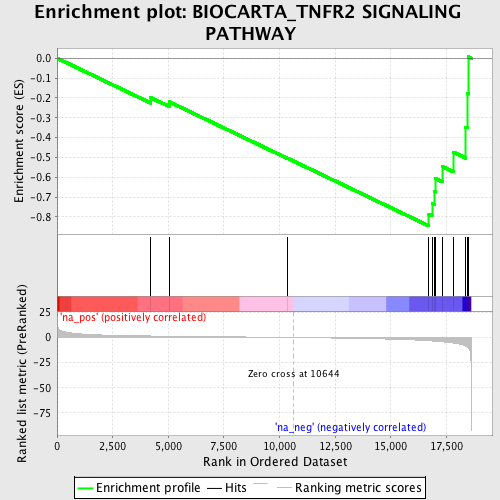
Profile of the Running ES Score & Positions of GeneSet Members on the Rank Ordered List
| Dataset | set03_truncNotch_versus_normalThy |
| Phenotype | NoPhenotypeAvailable |
| Upregulated in class | na_neg |
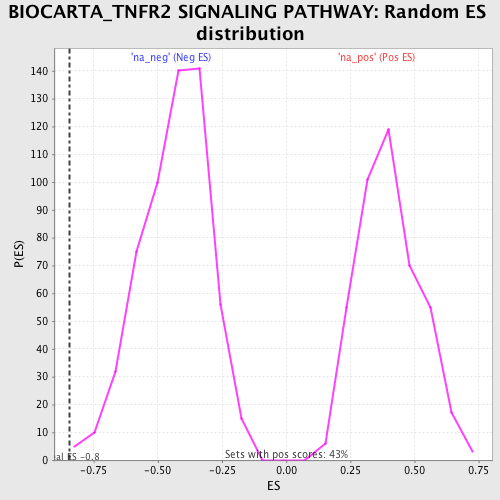
| GeneSet | BIOCARTA_TNFR2 SIGNALING PATHWAY |
| Enrichment Score (ES) | -0.84539324 |
| Normalized Enrichment Score (NES) | -1.9458898 |
| Nominal p-value | 0.0034843206 |
| FDR q-value | 0.056637384 |
| FWER p-Value | 0.419 |
| PROBE | GENE SYMBOL | GENE_TITLE | RANK IN GENE LIST | RANK METRIC SCORE | RUNNING ES | CORE ENRICHMENT | |
|---|---|---|---|---|---|---|---|
| 1 | TANK | 4209 | 1.505 | -0.1987 | No | ||
| 2 | TNFRSF1B | 5037 | 1.287 | -0.2196 | No | ||
| 3 | RIPK1 | 10351 | 0.086 | -0.5036 | No | ||
| 4 | RELA | 16711 | -3.206 | -0.7867 | Yes | ||
| 5 | NFKBIA | 16853 | -3.436 | -0.7314 | Yes | ||
| 6 | MAP3K14 | 16973 | -3.605 | -0.6719 | Yes | ||
| 7 | LTA | 17020 | -3.672 | -0.6071 | Yes | ||
| 8 | TRAF2 | 17307 | -4.186 | -0.5459 | Yes | ||
| 9 | MAP3K1 | 17806 | -5.436 | -0.4732 | Yes | ||
| 10 | TRAF3 | 18367 | -8.517 | -0.3474 | Yes | ||
| 11 | TRAF1 | 18445 | -9.479 | -0.1781 | Yes | ||
| 12 | TNFAIP3 | 18489 | -10.233 | 0.0068 | Yes |